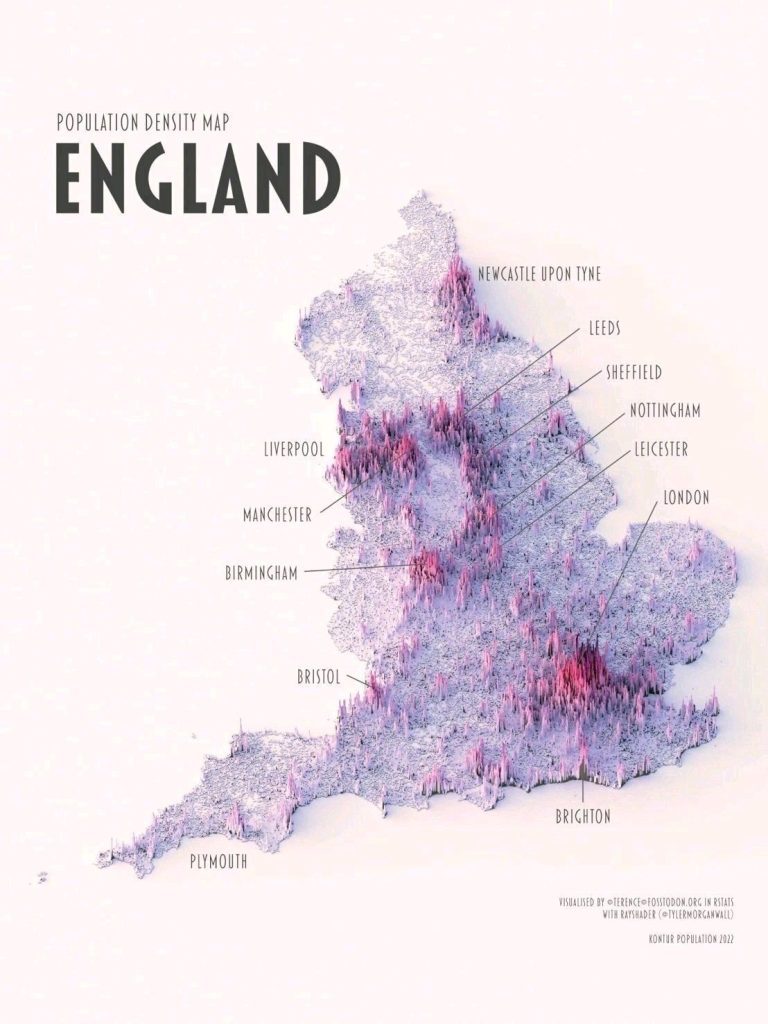
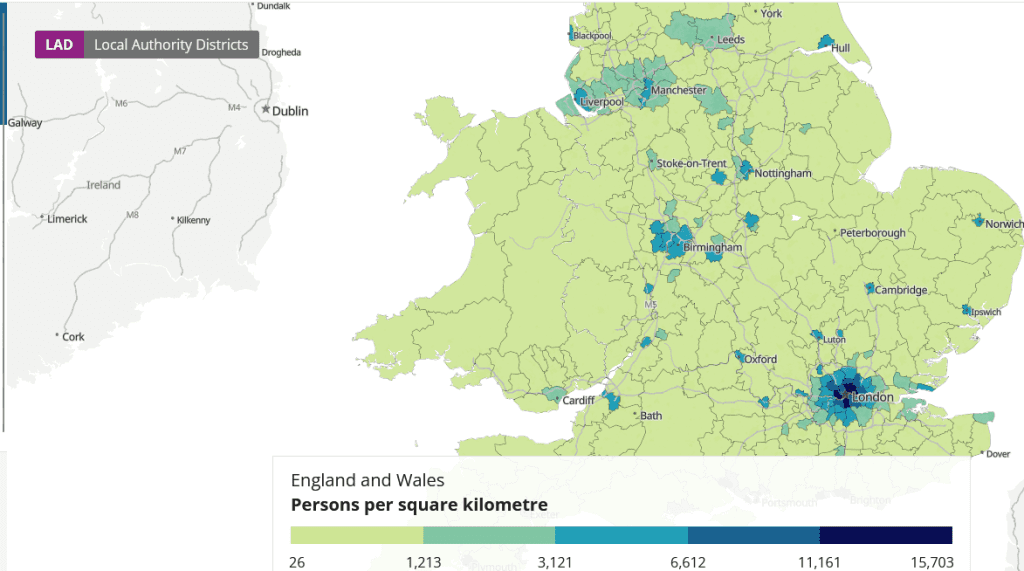
England’s cities and towns are home to millions of people, each with its own unique configuration of urban spaces and residential areas. Population density, a key aspect of urban planning and development, offers valuable insights into the spatial distribution of residents within these urban centres. In this article, we take a data-driven approach to explore the population densities of 25 of England’s cities, ranked in reverse order.
Using data available up to Spring 2020 from the Office for National Statistics (ONS) website, we have compiled a list of cities to compare and contrast their population densities. This analysis sheds light on the varying patterns of urban growth and development across England and helps us better understand the factors that shape the spatial layout of these cities. Read on to explore the population density landscape of England’s urban environments.
England’s Most Densely Populated Cities and Towns
25, Starting at number 25, we have the charming city of Worcester, with an approximate population density of 3,400 people per square kilometre. Known for its beautiful cathedral and the River Severn, Worcester is a delightful blend of history and modernity.
24, Gloucester, another historic city, comes in at number 24 with around 3,500 people per square kilometre. This city boasts the magnificent Gloucester Cathedral and an intriguing past.
23, Sunderland, at number 23, is a coastal city with a population density of approximately 3,600 people per square kilometre. This lively city is home to the National Glass Centre, showcasing the region’s glass-making heritage.
22, Portsmouth, a prominent naval port, ranks 22nd with around 3,700 people per square kilometre. The city is home to the Historic Dockyard, which houses the famous HMS Victory and the Mary Rose Museum.
21, Number 21 on our list is Exeter, a city steeped in Roman history, with a population density of about 3,800 people per square kilometre. The impressive Exeter Cathedral and ancient city walls are among its many attractions.
20, Plymouth, a vibrant coastal city, comes in at number 20 with approximately 3,900 people per square kilometre. The historic Barbican district and the Mayflower Steps are prominent reminders of the city’s maritime past.
19, Derby, ranking 19th, has a population density of around 4,000 people per square kilometre. The city has a rich industrial heritage and is also the gateway to the beautiful Peak District.
18, At number 18 is York, a city brimming with history, boasting approximately 4,200 people per square kilometre. The iconic York Minster and the well-preserved medieval streets make this city a popular tourist destination.
17, Leicester, a diverse and multicultural city, ranks 17th with around 4,300 people per square kilometre. Its rich history includes the discovery of King Richard III’s remains and the stunning Leicester Cathedral.
16, Norwich, at number 16, has a population density of about 4,400 people per square kilometre. This city is home to the magnificent Norwich Cathedral and a well-preserved medieval city centre.
15, Coventry, ranking 15th, has approximately 4,500 people per square kilometre. Known for its modernist architecture, Coventry Cathedral, and the historic St. Mary’s Guildhall, the city has much to offer.
14, Brighton and Hove, a vibrant seaside resort, comes in at number 14 with around 4,700 people per square kilometre. The famous Brighton Palace Pier and the Royal Pavilion are among the city’s main attractions.
13, Southampton, a major port city, ranks 13th with approximately 4,800 people per square kilometre. Home to the SeaCity Museum and the historic Tudor House, Southampton offers a mix of maritime history and modernity.
12, Stoke-on-Trent, famous for its pottery industry, is 12th on our list with around 5,000 people per square kilometre. The city houses the Potteries Museum and Art Gallery, showcasing the region’s ceramic heritage.
11, Kingston upon Hull, at number 11, has a population density of approximately 5,200 people per square kilometre. This maritime city is home to the fascinating Hull Maritime Museum and the striking Hull Old Town.
10, Nottingham, known for its Robin Hood legend, ranks 10th with around 5,400 people per square kilometre. The city features the historic Nottingham Castle and the extensive City of Caves.
9, Reading, an important commercial hub, comes in at number 9 with approximately 5,700 people per square kilometre. The picturesque Reading Abbey Ruins and the modern Oracle Shopping Centre are among its many attractions.
8, Bristol, a city rich in maritime history, ranks 8th with around 5,800 people per square kilometre. The iconic Clifton Suspension Bridge and the historic SS Great Britain bear witness to the city’s engineering prowess.
7, Sheffield, at number 7, has a population density of about 6,000 people per square kilometre. Known as the Steel City, Sheffield is surrounded by stunning landscapes, such as the Peak District National Park.
6, Manchester, a city with a strong industrial heritage, comes in at number 6 with approximately 6,100 people per square kilometre. Home to two world-renowned football clubs and a thriving cultural scene, Manchester is a vibrant city.
5, Birmingham, England’s second-largest city, ranks 5th with around 6,400 people per square kilometre. The city boasts a rich history, the striking Library of Birmingham, and a thriving culinary scene.
4, Liverpool, famous for its musical heritage and accent, is 4th on our list with approximately 6,500 people per square kilometre. The Beatles’ hometown is home to the iconic Royal Albert Dock and the historic Liverpool Cathedral.
3, Newcastle upon Tyne, at number 3, has a population density of about 6,700 people per square kilometre. This lively city is known for its vibrant nightlife, historic architecture, and the iconic Tyne Bridge.
2, Leeds, a major northern commercial centre, ranks 2nd with around 7,000 people per square kilometre. The city of Leeds offers a mix of modern shopping centres and historic landmarks, such as Kirkstall Abbey and Harewood House.
1, Finally, unsurprisingly London, the capital city, has a population density of approximately 5,700 people per square kilometre in inner London and 2,600 people per square kilometre in outer London. This global metropolis is a treasure trove of history, culture, and diversity.

Shaping Population Densities
As we examine the list of England’s cities by population density, it’s clear that there is a wide range of densities across the nation. This diversity can be attributed to a variety of factors, including historical development patterns, geographical constraints, and economic drivers. By understanding these factors, we can gain valuable insights into the unique challenges and opportunities each city faces in terms of urban planning, infrastructure, and overall livability.
One of the key factors that influence population density is the historical development of a city. Older cities may have originated from compact medieval centres, which can contribute to higher population densities in their historic cores. Conversely, cities that developed during the industrial revolution or later may have more dispersed populations due to the influence of suburban expansion and urban sprawl. These historical patterns can have lasting impacts on the urban form and population distribution of a city.
Geographical constraints also play a significant role in shaping population densities. Cities located in areas with limited developable land, such as coastal cities or those surrounded by protected natural landscapes, may have higher population densities as a result of restricted expansion opportunities. On the other hand, cities with ample space to grow may exhibit lower population densities as they have more room to expand and accommodate new residents.
Economic factors can also greatly influence population density. Cities with strong economic growth and job opportunities often attract more residents, leading to higher population densities. In contrast, cities facing economic challenges may experience population decline or stagnation, resulting in lower population densities. The economic landscape of a city can also shape its urban form, as the availability of employment and housing opportunities can impact where people choose to live within the city.
Explore more at Office for National Statistics (ONS)
The population density of a city is shaped by a complex interplay of historical, geographical, and economic factors. By examining the population densities of England’s cities, we can better understand the unique urban landscapes that have emerged as a result of these diverse influences. This understanding can help inform urban planning and development decisions, as well as contribute to the ongoing conversation about how to create sustainable, vibrant, and livable cities for all residents.
England’s cities, with their varying population densities, offer a fascinating insight into the country’s diverse history, culture, and urban landscapes. From the bustling streets of London to the historic charm of York, each city has its unique appeal. To explore the most recent data on population density, consult authoritative sources such as the Office for National Statistics (ONS).
- Overall population density: Approximately 432 people per square kilometer (as of mid-2020)
- Source: Office for National Statistics, United Kingdom
- Date: Mid-2020 data, published in June 2021
Please note that these figures may have changed since then. To access the most current data, visit the ONS website at www.ons.gov.uk or other relevant sources.
Here is a list of 25 towns and cities in England sorted by population density in reverse order:
- Worcester ~3,400 people per square kilometer
- Gloucester ~3,500 people per square kilometer
- Sunderland ~3,600 people per square kilometer
- Portsmouth ~3,700 people per square kilometer
- Exeter ~3,800 people per square kilometer
- Plymouth ~3,900 people per square kilometer
- Derby ~4,000 people per square kilometer
- York ~4,200 people per square kilometer
- Leicester ~4,300 people per square kilometer
- Norwich ~4,400 people per square kilometer
- Coventry ~4,500 people per square kilometer
- Brighton and Hove ~4,700 people per square kilometer
- Southampton ~4,800 people per square kilometer
- Stoke-on-Trent ~5,000 people per square kilometer
- Kingston upon Hull ~5,200 people per square kilometer
- Nottingham ~5,400 people per square kilometer
- Reading ~5,700 people per square kilometer
- Bristol ~5,800 people per square kilometer
- Sheffield ~6,000 people per square kilometer
- Manchester ~6,100 people per square kilometer
- Birmingham ~6,400 people per square kilometer
- Liverpool ~6,500 people per square kilometer
- Newcastle upon Tyne ~6,700 people per square kilometer
- Leeds ~7,000 people per square kilometer
- London ~5,700 people per square kilometer (inner London) and ~2,600 people per square kilometer (outer London)
Please note that these figures are approximate, and population densities can vary within each city depending on the specific area or neighborhood. For the most accurate and up-to-date data, consult the Office for National Statistics (ONS) or other reputable sources.
